Heart sounds and the cardiac cycle


Click images to enlarge. (Srodulski, n.d.; Klabunde, 2010)
Normal heart sounds
Normal heart sounds are caused by the physical movements of the heart as it beats. At specific stages during the cardiac cycle, the four valves of the heart open and slam closed according to the changing pressures of blood that act upon them; much as a slamming door will reverberate the air and building structure around it, the reverberation of the closing valves, chordae tendinae, and heart structure resonates through the blood and creates the audible heartbeat.
The paired normal heart sounds of the cardiac cycle comprise the first and second heart sounds, S1 and S2, which are often described as a lubb dubb … lubb dubb rhythm. The lubb of S1 is created when the high pressures of ventricular systole force the atrioventricular (AV) valves shut, preventing blood from reentering the low pressure areas of the atria. The dubb of S2 marks the onset of diastole. Once the pulsewave of ventricular systole has passed through the aorta and pulmonary artery, blood back-flows down the pressure gradient towards the now low pressure ventricles, closing the pulmonic and aortic valves. Although both S1 and S2 are referred to and usually heard as single sounds each, both are actually composed of two sounds. S1 consists of the sounds T1, caused by closure of the right AV valve, the tricuspid, and M1 is caused by closure of of the left AV valve, the mitral. S2 constitutes sounds of the pulmonic and aortic valves closing, known as A2 and P2 respectively. (Chizner, 2008).
The following videos review the cardiac cycle and normal heart sounds.
(ProfHeaslip, 2011a, 2011b)
The cardiac cycle
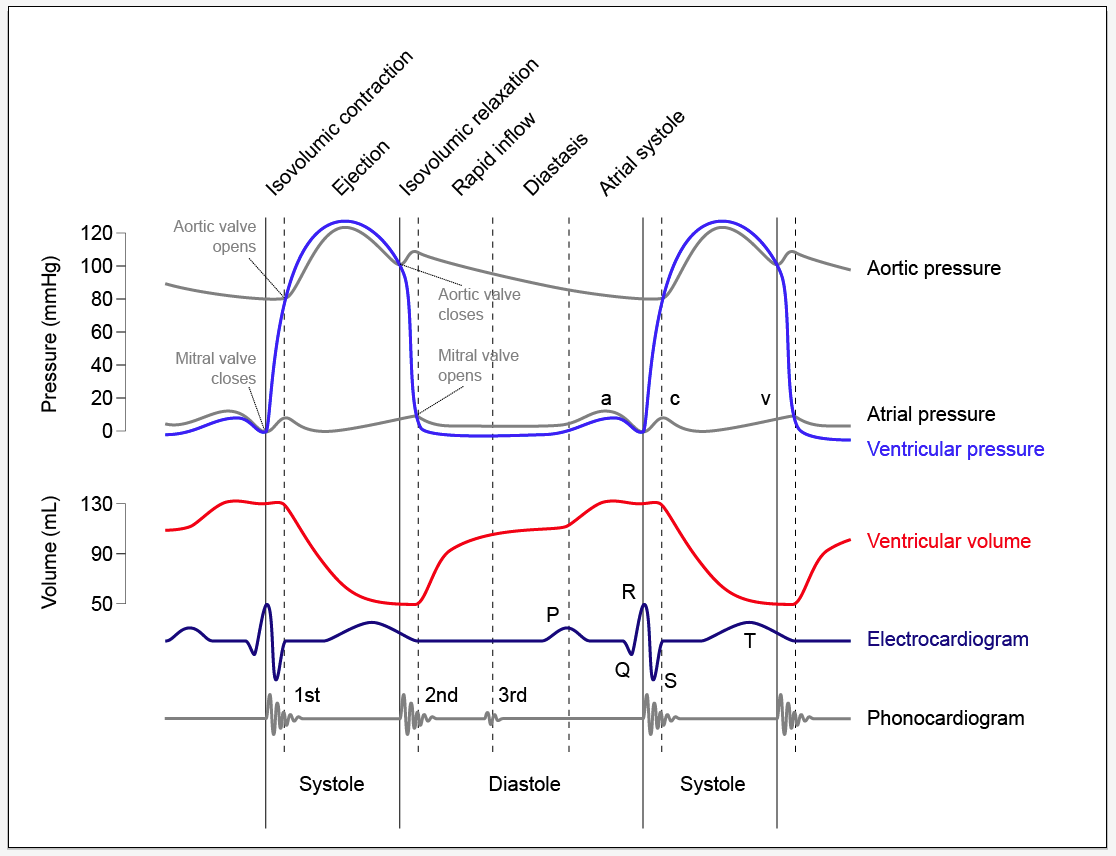
The Wiggers diagram below comprises events of the cardiac cycle for the left ventricle in the healthy heart, and illustrates how the valves open or close at the point when pressures either side of each valve briefly equalise. On the graph the mitral valve closes where line for atrial pressure is crossed by the rising ventricular pressure during systole, and later closes where falling ventricular pressure drops below atrial pressure again; the same is seen for the aortic valve, though at a much higher pressure point. Atrial pressures are notable for remaining relatively stable throughout the cardiac cycle, the minor increase during atrial systole reflecting the low muscle mass of the atria and the free flow of blood through the wide valve into the ventricle. (Lilly & Jung, 2011). The 'atrial kick' effect may be seen on the line for ventricular volume, where atrial systole forces the final 25% of blood volume into the near-full ventricle. This effect is lost in patients suffering atrial fibrillation (AF), causing reduced stroke volume and contractile force, thereby diminishing cardiac output. (Walsh, O'Rourke, & Shaver, 2011).
Wiggers diagram of the left ventricle during the cardiac cycle.

a = atrial contraction; c = raised pressure due to bulging of mitral valve during LV systole; v = passive filling during diastole. (WikiCommons, 2008).
The below table collates events of the cardiac cycle, including phases of the cycle, status of the heart valves, timing of heart sounds and of the carotid pulse, and phases waveforms of the ECG. The carotid pulse is palpated near immediately following S1, allowing differentiation of S1 and S2 during rapid heart rates in which the period of systole may exceed that of diastole.
Summary table of the events of the cardiac cycle.
Cardiac cycle
|
Heart sound
|
Heart valves
*
|
Heart - right side
|
Heart - left side
|
ECG
|
|
Diastole.
|
None.
|
T: open
M: open
P: closed
A: closed
|
Blood enters right atria from inferior & superior vena cavae, and flows passively through the open tricuspid valve into the right ventricle.
|
Blood enters left atria from pulmonary vein, and flows passively through the open mitral valve into the left ventricle.
|
T-P interval.
|
|
Late diastole / atrial systole.
|
None.
S4 is pathological.
|
T: open
M: open
P: closed
A: closed
|
Blood is forced out of the atria to fill the final 25% of the right ventricle. S4 results from forceful atrial conduction
|
Blood is forced out of the atria to fill the final 25% of the left ventricle.
|
P wave.
|
|
Ventricular systole.
|
S1.
The carotid pulse is palpated immediately after S1.
|
T: closes
M:closes
P: opens
A: opens
|
Ventricular systole closes the tricuspid valve (T1) and opens the pulmonic valve; papillary muscles are contracted to prevent tricuspid valve prolapse. Blood is ejected through the pulmonic valve into the pulmonary artery.
|
Ventricular systole closes the mitral valve (M1) and opens the aortic valve; papillary muscles are contracted to prevent mitral valve prolapse. Blood is ejected under high pressure through the aortic valve into the aortic artery.
|
QRS complex.
S1 is heard at the peak of the R wave.
|
|
End of systole / beginning of diastole.
|
S2.
|
T: opens
M: opens
P: closes
A: closes
|
Completion of ejection; as the ventricle empties the pressure within drops. The pulmonic valve closes once pulmonary artery pressure exceeds ventricular pressure(P2). The tricuspid valve opens once right atrial pressure exceeds ventricular pressure, and blood flows into the ventricle.
|
Completion of ejection; as the ventricle empties the pressure within drops. The aortic valve closes once aortic pressure exceeds ventricular pressure (A2), and the mitral valve opens once right atrial pressure exceeds ventricular pressure.
|
Downslope of T wave.
|
|
Early diastole.
|
None.
S3 is pathological.
|
T: open
M: open
P: closed
A: closed
|
Early diastolic filling. S3 is heard during rapid early ventricular filling; it may be normal in children and young adults, but is pathological in adults.
|
Early diastolic filling. S3 is heard during rapid early ventricular filling; it may be normal in children and young adults, but is pathological in adults.
|
T-P interval.
|
* Heart valves: A = aortic; M = mitral; P = pulmonic; T = tricuspid. (Chizner, 2008; Walsh, O’Rourke, & Shaver, 2011)
It is important to note that in the healthy heart only the closing of the valves should be heard, and that the contraction of the atria, the opening of the valves, and the flow of blood through the valves are not normally audible in adults. Variations to heart sounds and the presence of murmurs may indicate various pathologies, and the identification and significance of these is determined by their quality, timing, and in the context of patient condition. The major forms of heart sounds are presented over the following pages, along with relevant conditions most commonly seen in the prehospital setting, tips for auscultation of each particular sound, and example audio files. Before learning about these sounds however, we must learn how to hear them.
References
Chizner, M. (2008). Cardiac auscultation: rediscovering the lost art. Current Problems in Cardiology, 33(7)326-408.
ProfHeaslip. (2011a, Jun 7). 8-heart sounds [Video file]. Retrieved from http://www.youtube.com/watch?v=8lzh9kgnoaU
ProfHeaslip. (2011b, Jun 7). The cardiac cycle [Video file]. Retrieved from http://www.youtube.com/watch?v=Ee8QjwHTRWI
Srodulski, K. (n.d.). Anatomy of the heart [Image]. In C. Hanifin. (2010). Cardiac auscultation 101: A basic science approach to heart murmurs. Journal of the American Academy of Physician Assistants, 23(4), 44-48. Retrieved from http://media.jaapa.com/documents/13/cme_auscultation_3131.pdf
Lilly, L. & Jung, H. (2011). The cardiac cycle: mechanisms of heart sounds and murmurs. In L. Lilly (Ed.), Pathophysiology of Heart Disease. (5th Ed). Baltimore, Maryland: Lippincott Williams & Wilkins.
Walsh, R., O'Rourke, R., & Shaver, J. (2011). The history, physical examination, and cardiac auscultation. In V. Fuster, Walsh, R., & Harrington, R. (Eds.), Hurst's The Heart. (13th ed.). New York, NY: The McGraw-Hill Companies, Inc.
WikiCommons. (2012). Wiggers Diagram [Image]. Retrieved 23 May, 2012 from http://commons.wikimedia.org/wiki/File:Wiggers_Diagram.svg


Comments (0)
You don't have permission to comment on this page.